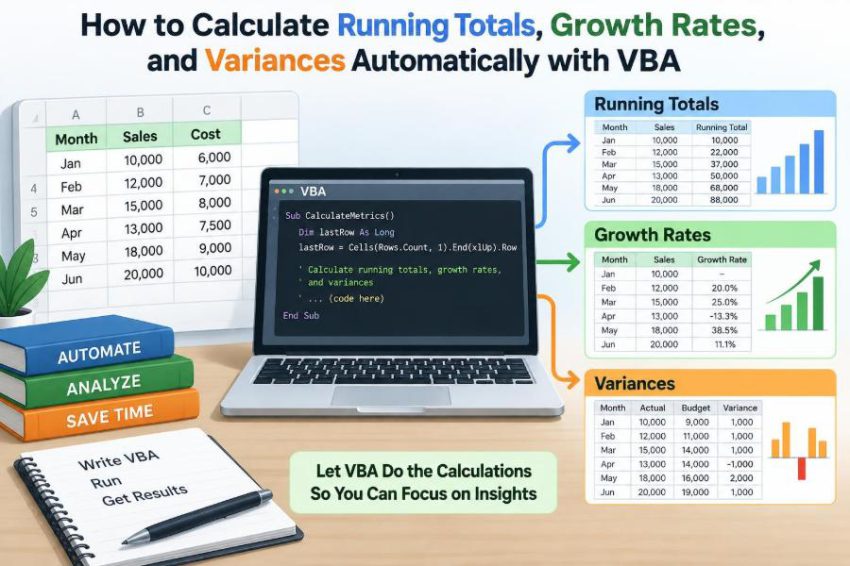

Monthly reports often begin as a simple worksheet: dates in column A, sales in column B, and a few formulas copied down. Then the data grows. New rows arrive, departments use slightly different layouts, and someone asks for year-to-date totals, month-over-month growth, and budget variances before the next meeting.
Excel formulas can handle much of this work, but repeated manual setup creates opportunities for broken references, inconsistent formats, and calculations that stop before the latest row. VBA can turn a recurring reporting task into a controlled process: read the data, calculate the measures, write the results, and flag problems.
The goal is not to replace every worksheet formula with code. It is to understand when a macro makes calculations more reliable, how each financial measure works, and how to write code that remains understandable when the workbook changes.
This guide uses a small reporting example, but the same ideas apply to expenses, inventory, project hours, customer counts, production volumes, and many other sequential datasets.
🧭 Start with the reporting question
Before writing VBA, define what each output means. A running total accumulates values over time. A growth rate compares the current period with a prior period. A variance compares an actual value with a reference such as a budget, forecast, or target.
These measures answer different questions. A running total shows progress toward an annual goal; growth shows momentum; variance shows whether performance differs from expectation. Treating them as interchangeable produces misleading reports.
📋 Use a predictable source layout
Automation is easiest when the source table follows a consistent pattern. For this example, row 1 contains headings and data begins in row 2.
| Column | Heading | Purpose |
|---|---|---|
| A | Month | Reporting period or date |
| B | Actual | Observed sales, cost, or other measure |
| C | Budget | Target or planned value |
The macro will write Running Total to column D, Growth % to column E, Variance to column F, and Variance % to column G. Real workbooks can use different columns, but decide that structure deliberately rather than relying on whichever columns happen to be empty.
🔢 Understand the running-total calculation
A running total is the current value plus all earlier values in the selected sequence. If January actual sales are 100 and February sales are 120, February’s running total is 220.
Mathematically, for period n, the cumulative amount is the sum of values from the first included period through period n. The order of rows therefore matters. A running total sorted alphabetically by month names is not a time-based total.
🧮 Build a running total with an accumulator
In VBA, an accumulator is a variable that retains a growing amount while a loop processes rows. It is usually clearer and faster than repeatedly asking Excel to sum an expanding range.
runningTotal = 0
For r = firstDataRow To lastRow
    runningTotal = runningTotal + Cells(r, "B").Value
    Cells(r, "D").Value = runningTotal
Next r
The variable starts at zero, adds each actual value, and writes the result on the same row. This approach also makes it straightforward to reset totals when a new year, product, or department begins.
📈 Define growth rates carefully
Period-over-period growth measures relative change. The common formula is (current value − previous value) / previous value. If actual sales move from 100 to 120, growth is 20%.
Growth is a rate, not a currency amount. A change of 20 may be dramatic for a small product line and negligible for a large one. Pairing a percentage with the underlying values prevents readers from drawing conclusions from the rate alone.
🚫 Handle zero and blank prior values
Growth cannot be calculated normally when the prior value is zero because division by zero is undefined. A blank prior value also needs a policy: it may mean missing data, or it may mean “no activity.” Those are not the same thing.
A practical report often leaves growth blank when there is no valid prior value. Showing 0% would incorrectly suggest no change, while forcing an error into the report makes review harder.
If previousValue <> 0 And IsNumeric(previousValue) Then
    growthRate = (currentValue - previousValue) / previousValue
    Cells(r, "E").Value = growthRate
Else
    Cells(r, "E").ClearContents
End If
🔁 Recognize negative-value growth limits
Percentage growth becomes harder to interpret when values are negative. Moving from -100 to -50 is operationally an improvement, yet the standard formula returns -50%. Moving from -50 to 50 crosses zero and may create a percentage that is technically calculated but not especially meaningful.
For profit, cash flow, or cost categories that can be negative, consider reporting the absolute change alongside the percentage. The macro should calculate the agreed measure; the report design should explain how readers are expected to interpret it.
⚖️ Calculate variance as an amount
Variance is normally the difference between actual and budget:
variance = actualValue - budgetValueA positive variance is favorable for sales or profit, but it can be unfavorable for expenses. The arithmetic is identical; the business meaning is not. Label columns precisely, such as “Sales Variance” or “Expense Variance,” so users do not assume positive always means good.
📊 Add variance percentage for context
Variance percentage expresses the difference relative to budget: (Actual − Budget) / Budget. An actual of 110 against a budget of 100 produces a 10% variance.
As with growth, a zero budget needs special handling. If a department had no approved budget, a percentage comparison may be unavailable even though the currency variance remains useful.
🧱 Set up explicit worksheet references
A macro should avoid relying on whichever sheet is active. Someone may run it while viewing a dashboard, another workbook, or an unrelated worksheet. Explicit references make the code more dependable.
Option Explicit

Sub CalculateMetrics()
    Dim ws As Worksheet
    Set ws = ThisWorkbook.Worksheets("Report")
End Sub
ThisWorkbook means the workbook containing the macro. That is usually safer than ActiveWorkbook, which can refer to a different open file.
🛡️ Require variable declarations
Option Explicit forces VBA to reject undeclared variable names. This catches typos such as writing runningTotla in one line and runningTotal elsewhere.
Use suitable data types. Long is appropriate for row numbers. Double is convenient for percentages and many numeric calculations. For currency-sensitive business models, Currency can avoid some floating-point representation issues, although its range and precision should still suit the workbook’s needs.
🔎 Find the last data row dynamically
Hard-coding a final row such as 500 works only until the data exceeds it—or leaves old results below the real dataset. Instead, locate the final used row in a required column.
lastRow = ws.Cells(ws.Rows.Count, "A").End(xlUp).RowThis starts at the bottom of column A and moves upward to the first nonblank cell. It assumes column A is populated for every valid record. If dates may be blank, choose a more reliable key column or validate the source before calculation.
🧹 Clear old output before recalculating
When this month’s data has fewer rows than last month’s, earlier output can remain below the new dataset. Those stale values may be included in charts or copied into a report.
ws.Range("D2:G" & ws.Rows.Count).ClearContentsClear only result columns, not the entire worksheet. A targeted reset preserves source data, headings, and any formatting that users need.
🔄 Loop through the data once
For a straightforward report, one loop can calculate all four outputs. Keeping related calculations together helps readers see how values move from input columns to output columns.
Dim r As Long, lastRow As Long
Dim runningTotal As Double
Dim actualValue As Double, budgetValue As Double
Dim previousValue As Variant

lastRow = ws.Cells(ws.Rows.Count, "A").End(xlUp).Row
runningTotal = 0

For r = 2 To lastRow
    actualValue = ws.Cells(r, "B").Value
    budgetValue = ws.Cells(r, "C").Value
    runningTotal = runningTotal + actualValue
    ws.Cells(r, "D").Value = runningTotal
Next r
The remaining calculations can be added inside this same loop after validation.
✅ Validate values before using them
Cells may contain blanks, text such as “pending,” error values, or numbers stored as text. Adding or dividing these values without checks can stop the macro or silently create an incorrect result.
IsNumeric is a useful first test. Decide whether blanks should be treated as zero, skipped, or flagged. For financial reporting, silently converting missing actuals to zero can distort totals, so a visible warning is often the safer choice.
🧾 Write descriptive output headings
Automation should make reports easier to audit, not merely faster to create. Write clear headings each time the procedure runs, especially if a template may be copied or modified.
ws.Range("D1").Value = "Running Total"
ws.Range("E1").Value = "Growth %"
ws.Range("F1").Value = "Variance"
ws.Range("G1").Value = "Variance %"
Names such as “Difference” or “Change” can be ambiguous. A future user should be able to identify the comparison without opening the VBA editor.
🎨 Format numbers after calculation
Formatting affects readability, not the stored calculation. Currency or accounting formats are usually suitable for actuals, budgets, running totals, and absolute variances. Growth and variance percentages should use percentage formatting.
ws.Range("B2:D" & lastRow).NumberFormat = "#,##0.00"
ws.Range("F2:F" & lastRow).NumberFormat = "#,##0.00"
ws.Range("E2:E" & lastRow).NumberFormat = "0.0%"
ws.Range("G2:G" & lastRow).NumberFormat = "0.0%"
Use a number format appropriate to your organization’s currency conventions. Do not multiply a percentage by 100 in code if Excel will also display it with a percentage format.
📅 Sort time periods before accumulating
A running total and growth calculation assume chronological order. Dates stored as real Excel dates can be sorted reliably. Text such as “Jan,” “Feb,” and “Mar” may sort alphabetically unless the workbook uses a custom list or a separate period number.
For recurring reports, sort the source data before calculation or require users to supply it in order. If rows may contain several years, sort by year and period rather than month name alone.
🗓️ Reset totals at the right boundary
Year-to-date reporting normally resets when the year changes. Product-level reporting may reset when a product code changes. The reset rule belongs to the business definition, not to VBA by default.
If Year(ws.Cells(r, "A").Value) <> Year(ws.Cells(r - 1, "A").Value) Then
    runningTotal = 0
End If
Use this pattern only after confirming that dates are valid and rows are sorted. A similar condition can reset the accumulator when a department, account, or project identifier changes.
🧩 Calculate grouped metrics with a key
When rows contain multiple categories, a single running total mixes them together. For example, sales for Product A and Product B need separate cumulative values if the report is meant to show each product’s progress.
For sorted groups, compare the current category with the prior row and reset when it changes. For unsorted data, a VBA Dictionary can store a separate running total for each key. That is more flexible, but it also requires a clear choice about the order in which each group’s growth is calculated.
🧠 Separate calculation rules from cell locations
Small macros can use column letters directly. As they grow, scattered references such as "B" and "G" become difficult to maintain. Assign constants near the top of the procedure or locate columns by their headers.
Const COL_MONTH As Long = 1
Const COL_ACTUAL As Long = 2
Const COL_BUDGET As Long = 3
Const COL_RUNNING As Long = 4
This does not eliminate all maintenance, but it makes a layout change visible in one place. Header-based lookup is useful for imported files, provided heading names are controlled consistently.
⚡ Reduce worksheet traffic for larger datasets
Reading and writing individual cells is easy to understand, but each worksheet interaction has overhead. On larger ranges, it is often faster to read source values into a VBA array, process the array in memory, and write a result array back in one operation.
Use that optimization after the simple version is correct. Array code has more indexing detail and can be harder to debug. For a short monthly table, clarity may matter more than a small speed improvement.
⏱️ Manage Excel settings responsibly
Disabling screen updating can make a macro feel faster and reduce distracting redraws. Calculation mode may also be changed for demanding workbooks, but it must always be restored, even if an error occurs.
Application.ScreenUpdating = False
On Error GoTo CleanUp
' Calculation code goes here
CleanUp:
Application.ScreenUpdating = True
Do not turn off events or automatic calculation casually. Those settings can affect other workbook processes, including event-driven macros and formulas users expect to update.
🧯 Add error handling with a useful cleanup path
Error handling is not a substitute for validation, but it protects the workbook environment when something unexpected occurs. A cleanup label restores application settings and can show a plain-language message.
On Error GoTo HandleError
' Main procedure
GoTo CleanUp

HandleError:
    MsgBox "The report could not be calculated: " & Err.Description
CleanUp:
    Application.ScreenUpdating = True
Avoid broad On Error Resume Next around calculation logic. It suppresses errors that may reveal missing data, incorrect sheet names, or invalid formulas.
🧪 Test a small hand-worked example
Before trusting a full report, make a three- or four-row test dataset and calculate the expected results manually. Suppose actuals are 100, 120, and 90, while budgets are 95, 110, and 100.
- Running totals should be 100, 220, and 310.
- Growth should be blank for the first row, then 20% and -25%.
- Absolute variances should be 5, 10, and -10.
- Variance percentages should be approximately 5.26%, 9.09%, and -10%.
This test checks both arithmetic and report conventions. It also reveals whether the first row is being handled intentionally.
🔍 Reconcile macro output with formulas
During development, compare VBA output with temporary worksheet formulas. For example, a running-total formula can sum from the first actual cell to the current row, while a variance formula subtracts budget from actual.
If results disagree, inspect the inputs first: row order, numeric types, blanks, and the prior-period rule. Do not assume the macro is wrong simply because a formula looks familiar; formula references can also be misaligned.
🧷 Decide how to treat missing periods
A missing month is different from a month with zero activity. If March is absent and April follows February, should April growth compare with February, show blank, or trigger a data-quality warning? There is no universal answer.
For management reporting, a gap often deserves a flag because it may indicate incomplete data. For transaction-based datasets, missing dates may be normal. Make the rule explicit in the report’s process documentation.
📉 Use conditional formatting thoughtfully
VBA can apply formatting rules, but visual signals should support rather than replace the numbers. Highlighting negative sales variance may help attention, while the same color for negative expense variance may mislead because spending below budget can be favorable.
Where possible, use labels that state direction and meaning, or create separate rules for revenue and expense rows. Color alone is also not accessible to every reader, so retain signs, values, and descriptive headings.
🧰 A complete baseline procedure
The following example brings together the core logic for a single, chronological series. It assumes valid dates in column A and numeric actual and budget values in columns B and C.
Option Explicit

Sub CalculateMetrics()
    Dim ws As Worksheet
    Dim lastRow As Long, r As Long
    Dim runningTotal As Double
    Dim actualValue As Double, budgetValue As Double
    Dim previousValue As Double

    On Error GoTo HandleError
    Application.ScreenUpdating = False
    Set ws = ThisWorkbook.Worksheets("Report")

    lastRow = ws.Cells(ws.Rows.Count, "A").End(xlUp).Row
    If lastRow < 2 Then GoTo CleanUp

    ws.Range("D2:G" & ws.Rows.Count).ClearContents
    ws.Range("D1:G1").Value = Array("Running Total", "Growth %", "Variance", "Variance %")

    runningTotal = 0
    For r = 2 To lastRow
        If IsNumeric(ws.Cells(r, "B").Value) And IsNumeric(ws.Cells(r, "C").Value) Then
            actualValue = ws.Cells(r, "B").Value
            budgetValue = ws.Cells(r, "C").Value
            runningTotal = runningTotal + actualValue
            ws.Cells(r, "D").Value = runningTotal
            ws.Cells(r, "F").Value = actualValue - budgetValue
            If budgetValue <> 0 Then ws.Cells(r, "G").Value = (actualValue - budgetValue) / budgetValue
            If r > 2 Then
                previousValue = ws.Cells(r - 1, "B").Value
                If previousValue <> 0 Then ws.Cells(r, "E").Value = (actualValue - previousValue) / previousValue
            End If
        End If
    Next r

    ws.Range("E2:E" & lastRow).NumberFormat = "0.0%"
    ws.Range("G2:G" & lastRow).NumberFormat = "0.0%"
CleanUp:
    Application.ScreenUpdating = True
    Exit Sub
HandleError:
    MsgBox "Calculation stopped: " & Err.Description
    Resume CleanUp
End Sub
⚠️ Know the limits of this baseline
This procedure is a starting point, not a universal financial model. It assumes that a numeric prior-row actual exists when calculating growth, that all rows belong to one sequence, and that a positive variance is presented without a favorable/unfavorable judgment.
Adapt it before using it for audited reporting, multi-currency workbooks, irregular fiscal calendars, or data with multiple categories. In those cases, validation, grouping, and review controls deserve more attention than compact code.
🗂️ Keep an audit trail when decisions rely on the report
When calculations support operational or financial decisions, preserve the inputs and the date of the run. A macro can write a timestamp, copy a snapshot to an archive sheet, or record the source file name—depending on the organization’s process.
The purpose is traceability: a reviewer should be able to understand which data produced a result. VBA improves repeatability, but it does not remove the need for sensible review and data ownership.
🚀 Choose formulas, VBA, or both
Worksheet formulas are excellent when users need to inspect calculations directly, adjust assumptions, or work with a modest, stable table. VBA is especially useful when the same preparation and calculation steps recur across files or when outputs need controlled refresh logic.
A hybrid design is often best. VBA can import, clean, sort, and prepare a report; formulas or PivotTables can remain visible for analysis. The right choice depends on who maintains the workbook and how much transparency the audience needs.
🎯 Build automation around clear definitions
Reliable calculation automation begins with agreed definitions: what counts as a period, what resets a total, which baseline growth uses, and what a variance means in context. VBA then applies those rules consistently, row after row.
The core pattern is simple: identify valid data, process it in the correct order, handle exceptions explicitly, and present outputs so that another person can verify them. That pattern is more valuable than any single code snippet.
When VBA calculations mirror well-defined reporting rules, running totals, growth rates, and variances become repeatable results rather than fragile monthly chores. 📈🧮✅