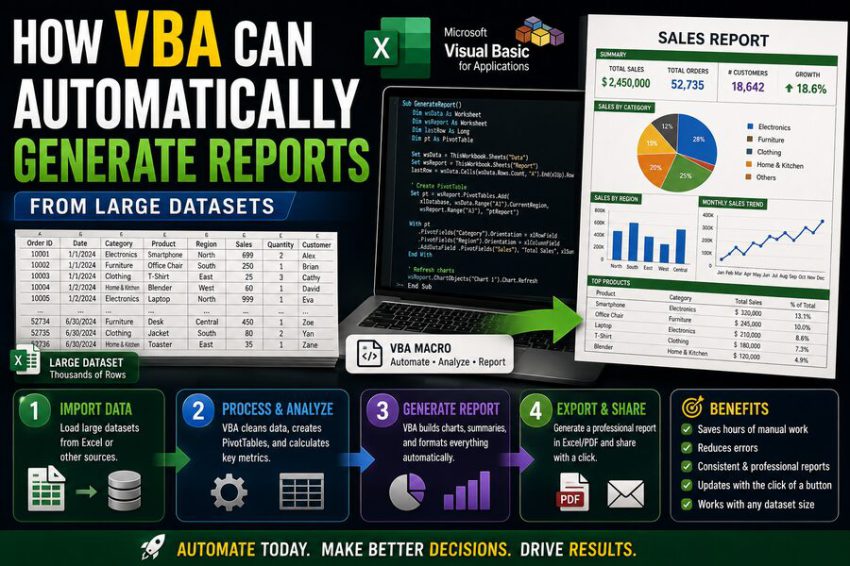

Large datasets can quickly turn routine reporting into a tedious process. Imagine receiving a spreadsheet containing 100,000 rows of sales transactions and being asked to create separate monthly summaries, regional performance tables, charts, PDF reports, and management dashboards.
Doing all of that manually could take hours. 😓
This is where VBA, or Visual Basic for Applications, becomes extremely useful.
VBA is a programming language built into Microsoft Office applications such as Excel. It allows users to automate repetitive tasks, manipulate worksheets, analyze data, create charts, format reports, export files, and even generate entire reporting packages with the click of a button. ⚙️📈
For businesses that rely heavily on Excel, VBA can turn a slow manual reporting process into a repeatable automated workflow.
The basic idea is simple:
Raw data → VBA automation → calculations → formatted report → charts → exported files
Instead of rebuilding the same report every week or month, the user creates the automation once and lets Excel perform the repetitive work.
💻 What Exactly Is VBA?
VBA stands for Visual Basic for Applications.
It is a programming language developed for automating tasks inside Microsoft Office applications.
In Excel, VBA can control almost everything a user normally does manually.
For example, VBA can:
- Open workbooks 📂
- Read thousands of rows
- Filter data
- Perform calculations
- Create new worksheets
- Copy information
- Format cells
- Build charts 📊
- Create PivotTables
- Save files
- Export reports as PDFs
- Send reports through Outlook
A VBA program is usually written inside Excel’s Visual Basic Editor.
The code can then be attached to a button, keyboard shortcut, workbook event, or automated process.
🧠 Why VBA Is Useful for Large Reports
Large reports often involve the same sequence of steps every reporting period.
For example, a financial analyst may do this every month:
- Download transaction data.
- Remove unnecessary columns.
- Clean missing values.
- Calculate revenue and costs.
- Group transactions by region.
- Create summary tables.
- Update charts.
- Format the report.
- Export it to PDF.
- Send it to managers.
None of these tasks may be individually difficult.
The problem is repetition.
If the analyst spends three hours doing this every month, that becomes 36 hours every year for just one report.
If a company produces 50 recurring reports, manual effort can become enormous.
VBA turns the process into code.
Once the logic is reliable, the same report can often be regenerated in seconds or minutes. ⚡
📂 Step 1: Importing or Reading the Raw Dataset
The first task is usually getting data into Excel.
VBA can automatically open another workbook and copy its data into a reporting workbook.
Conceptually, the macro may perform:
Open source file → identify dataset → copy records → close source file
It can also work with CSV files, text files, and other Excel workbooks.
For example, imagine the organization exports:
Sales_Transactions.csv
every morning.
A macro can locate the file, import the data, and begin processing it immediately.
This removes the need for employees to repeatedly copy and paste large datasets manually.
🔍 Step 2: Identifying the Size of the Dataset
One common problem with automated reports is that the number of records changes.
Monday’s file might contain 40,000 rows.
Tuesday’s file might contain 57,000.
A good VBA macro should therefore avoid assuming that data always ends at a fixed row.
Instead, it can identify the last populated row dynamically.
This allows the code to determine the actual data range before processing it.
Conceptually:
Find last row → define data range → process all records
This is essential for reliable automation because the report can adapt as datasets grow or shrink.
🧹 Step 3: Cleaning the Data Automatically
Real datasets are rarely perfect.
They may contain:
- Blank rows
- Missing values
- Duplicate entries
- Incorrect dates
- Extra spaces
- Text stored as numbers
- Invalid categories
VBA can automate many data-cleaning operations.
For example, a macro might:
- Remove duplicate transaction IDs
- Delete empty rows
- Replace missing categories with “Unknown”
- Standardize date formats
- Trim extra spaces
- Convert numeric text into numbers
This creates a consistent dataset before calculations begin.
Automating data cleaning also reduces human error.
A user cleaning 100,000 rows manually may easily miss problems.
A macro applies the same rules every time. 🧹⚙️
🧮 Step 4: Performing Calculations
Once the data is clean, VBA can calculate important metrics.
Suppose each row contains:
- Product
- Quantity
- Unit price
- Cost
- Region
- Salesperson
VBA can calculate values such as:
Revenue = Quantity × Unit Price
Gross Profit = Revenue − Cost
Margin % = Gross Profit / Revenue
These formulas can be inserted automatically across thousands of records.
But for large datasets, it may be more efficient for VBA to perform calculations directly in memory rather than constantly writing formulas to individual cells.
That distinction can have a major impact on performance.
🚀 Why Working in Memory Is Faster
One of the most important VBA performance concepts is avoiding unnecessary interaction with worksheet cells.
Reading or writing one cell at a time can be slow.
Imagine processing 200,000 rows.
If VBA repeatedly accesses individual cells, Excel may need to perform hundreds of thousands of separate operations.
A much faster strategy is often:
Read the entire data range into an array → process the array in memory → write results back at once
Arrays are data structures stored in computer memory.
This approach can dramatically speed up reporting macros. ⚡
The principle is:
Fewer worksheet interactions = faster VBA
📊 Step 5: Creating Summary Tables
Managers rarely want to inspect 100,000 raw transactions.
They want summaries.
For example:
| Region | Revenue | Profit |
|---|---|---|
| North | $2.4M | $480K |
| South | $1.9M | $350K |
| East | $2.7M | $520K |
| West | $2.1M | $410K |
VBA can build these summaries automatically.
It may calculate totals using:
- Worksheet formulas
- PivotTables
- Dictionaries
- Arrays
- SQL queries
- Excel functions
The macro can group information by:
- Region
- Month
- Product
- Customer
- Department
- Salesperson
This is one of the most common uses of VBA reporting automation.
🔄 Automating PivotTables
PivotTables are excellent for summarizing large datasets.
VBA can create or refresh PivotTables automatically.
A reporting macro may:
- Identify the latest dataset.
- Create a PivotCache.
- Build or refresh a PivotTable.
- Place fields into rows and columns.
- Add revenue and profit as values.
- Apply filters.
- Format the results.
This means users do not need to rebuild PivotTables every reporting period.
The underlying data changes, but the VBA code reconstructs the report consistently. 📊
📈 Step 6: Automatically Generating Charts
Charts make large datasets easier to understand.
VBA can create and update charts based on summarized data.
For example, a monthly sales report might automatically generate:
- Revenue trend line 📈
- Sales by region bar chart
- Product share pie chart
- Profit margin chart
- Top customers chart
The macro can also control:
- Chart titles
- Axis labels
- Data ranges
- Legends
- Chart size
- Placement
So one button can transform raw transactions into a polished visual report.
🎨 Step 7: Formatting the Report
A report should not only be correct.
It should also be readable.
VBA can apply formatting consistently.
For example, it can:
- Make headers bold
- Apply number formats
- Format percentages
- Add borders
- Resize columns
- Freeze header rows
- Apply conditional formatting
- Set print areas
- Add titles and dates
This is especially valuable in organizations where reports must follow a standard template.
Instead of relying on every employee to format reports manually, the code applies the same appearance every time. 🎯
🧭 Creating Different Reports for Different Managers
Suppose a company operates in 20 regions.
The national manager needs the complete dataset.
Each regional manager should receive only their own region.
Manually creating 20 separate reports could take a long time.
VBA can automate the entire process.
The macro may:
Find unique regions → filter data → create workbook → generate report → save file → repeat
The output might look like:
North_Region_Report.xlsx
South_Region_Report.xlsx
East_Region_Report.xlsx
and so on.
The same technique can create separate reports for:
- Departments
- Sales representatives
- Branches
- Customers
- Products
This is sometimes called report bursting.
📄 Automatically Exporting Reports to PDF
Many organizations distribute reports as PDFs rather than editable spreadsheets.
VBA can automatically export worksheets or ranges into PDF files.
A reporting process might perform:
Generate dashboard → format pages → export PDF → save to report folder
The resulting file could be named automatically using the current date:
Monthly_Sales_Report_2026-08.pdf
This reduces the risk of users accidentally saving reports with inconsistent names.
It also creates a repeatable archive of historical reports. 📁
📧 VBA Can Even Email the Finished Report
VBA can integrate with Microsoft Outlook.
That means the automation can potentially:
- Generate the report.
- Export it as a PDF.
- Open Outlook.
- Create an email.
- Attach the report.
- Add recipients.
- Send or display the email.
A monthly process that previously required dozens of manual steps can become highly automated. 📧
However, organizations should apply appropriate security controls before allowing macros to automatically distribute sensitive information.
📅 Automatically Creating Monthly Reports
Suppose the raw dataset contains several years of sales records.
VBA can identify unique months and generate a report for each one.
For example:
January → report
February → report
March → report
The macro can loop through each month, filter transactions, calculate totals, update charts, and save separate files.
The same approach works with:
- Weeks
- Quarters
- Fiscal periods
- Years
This can be particularly valuable when historical reports must be regenerated after changes to business rules.
🔁 The Power of Loops
VBA uses programming structures called loops to repeat operations.
Imagine 50 branches.
Instead of writing code 50 times, the macro can effectively say:
For each branch:
- Filter the dataset
- Calculate results
- Build the report
- Save the file
Then move to the next branch.
Loops are one of the reasons automation is so powerful.
The computer does not care whether it repeats a task 5 times or 5,000 times. 🔄
🧠 Using Dictionaries for Fast Grouping
For some large datasets, VBA developers use objects called Dictionaries.
A dictionary stores information using key-value pairs.
For example:
“North” → $2,400,000
“South” → $1,900,000
As VBA processes each transaction, it can add the transaction’s revenue to the appropriate region.
This can produce fast summaries without repeatedly searching worksheet cells.
Dictionaries are especially useful when grouping large datasets by:
- Customer
- Product
- Region
- Employee
- Category
⚡ Turning Off Excel Features Temporarily
Large VBA macros can become slow because Excel performs background work after every change.
For example, Excel may:
- Refresh the screen
- Recalculate formulas
- Trigger events
Experienced VBA developers often temporarily disable some of these features while the macro runs.
Typical optimizations include disabling:
- Screen updating
- Automatic calculation
- Events
After the macro finishes, these settings must be restored.
This can dramatically reduce processing time. 🚀
🛡️ Why Error Handling Is Essential
Automation can fail.
A source file may be missing.
A worksheet name may change.
A dataset may contain unexpected values.
A folder may not exist.
Professional VBA code should include error handling.
Instead of simply crashing, the macro can detect a problem and respond appropriately.
For example:
If source file missing → display clear error message
or:
If report folder missing → create it
Good error handling turns a fragile macro into a more reliable business tool.
✅ Data Validation Before Report Generation
A strong reporting system should check the source data before producing results.
For example, VBA might verify:
- Required columns exist
- Transaction IDs are present
- Dates are valid
- Revenue values are numeric
- No impossible negative quantities exist
If critical errors are detected, the macro can stop and alert the user.
This prevents a beautifully formatted report from being generated from incorrect data. ⚠️
🧪 Testing Automated Reports
Automation does not eliminate the need for validation.
Before trusting a VBA reporting system, users should compare automated results against manually verified calculations.
Testing may include:
- Checking totals
- Comparing sample records
- Testing empty datasets
- Testing unusually large datasets
- Testing missing files
- Testing unexpected categories
A macro should be tested against realistic failure scenarios, not only ideal data.
🔐 Macro Security Matters
VBA code can automate powerful actions.
Unfortunately, malicious macros can also perform harmful actions.
Organizations should therefore use sensible macro security practices.
These may include:
- Running only trusted macros
- Digitally signing approved VBA projects
- Restricting unknown macro-enabled files
- Storing reporting tools in controlled locations
Employees should not enable macros from unknown email attachments simply because Excel asks them to.
Security is an essential part of professional VBA deployment. 🛡️
🗃️ VBA vs. Power Query
VBA is not the only Excel automation technology.
Power Query is often excellent for:
- Importing data
- Cleaning data
- Combining files
- Reshaping tables
For some reporting workflows, Power Query may be simpler and more maintainable than VBA.
A powerful solution may use both:
Power Query → data preparation
VBA → report generation, formatting, exporting, and distribution
Choosing the right tool for each task can make the system more reliable.
📊 VBA vs. PivotTables
PivotTables are excellent for interactive summaries.
But if users need to create 50 differently filtered reports and export every one automatically, VBA can control the process.
In other words:
PivotTables summarize data.
VBA can automate the entire reporting workflow around them.
They are complementary technologies.
🗄️ VBA vs. Databases
Excel is powerful, but it is not designed to replace a large enterprise database.
When datasets become extremely large or multiple users need simultaneous access, storing all raw data inside spreadsheets may become inefficient.
A more scalable architecture might use:
Database → SQL query → Excel → VBA-generated report
VBA can retrieve only the information needed for a particular report.
This keeps Excel focused on presentation and analysis rather than functioning as the primary data warehouse.
📏 Excel’s Row Limit Matters
Modern Excel worksheets support a maximum of 1,048,576 rows.
That sounds enormous, but some organizations generate more records than this.
If a dataset approaches Excel’s limits, VBA cannot magically remove the worksheet limitation.
Possible alternatives include:
- Databases
- Power Query
- Power Pivot
- SQL
- Dedicated analytics tools
VBA remains valuable, but the overall data architecture must match the scale of the problem.
📉 Example: Automating a Sales Report
Imagine a company receives a dataset containing 250,000 transactions.
The reporting macro could perform this workflow:
Step 1: Import the latest transaction file.
Step 2: Validate required columns.
Step 3: Remove duplicates.
Step 4: Calculate revenue and profit.
Step 5: Group sales by region.
Step 6: Identify the top 10 products.
Step 7: Refresh PivotTables.
Step 8: Update charts.
Step 9: Format the dashboard.
Step 10: Generate one PDF for each regional manager.
Step 11: Save all files inside the monthly-report folder.
A process that once required hours of manual work could become a mostly automated routine. ⚙️📊
💰 Why Report Automation Has Business Value
The value of VBA automation is not just about saving time.
It can also improve:
- Consistency
- Accuracy
- Reporting speed
- Employee productivity
- Auditability
Suppose an analyst spends four hours every week generating reports.
That equals roughly:
4 × 52 = 208 hours per year
If automation reduces the process to 20 minutes of review, hundreds of working hours can be redirected toward analysis and decision-making.
And if multiple employees perform similar reporting tasks, the savings can become substantial.
🧠 Automation Changes the Analyst’s Role
Manual reporting often forces analysts to spend time on low-value activities:
- Copying
- Pasting
- Formatting
- Renaming files
- Refreshing charts
Automation allows them to focus on higher-value questions:
Why did revenue decline?
Which customers are most profitable?
What operational problem caused the variance?
That is one of the greatest benefits of reporting automation.
VBA does not simply make Excel faster.
It can change how employees use their time. 🧠📈
⚠️ When VBA May Not Be the Best Choice
VBA is extremely useful, but it is not perfect for every reporting system.
Another solution may be better when:
- Data exceeds Excel’s practical scale.
- Hundreds of users need simultaneous access.
- Reports need to run on cloud servers.
- Real-time dashboards are required.
- Complex enterprise governance is needed.
Tools such as SQL databases, Python, Power BI, and dedicated reporting platforms may be more appropriate in those situations.
The best approach is not to use VBA everywhere.
It is to use VBA where Excel-based automation provides the best balance of simplicity, cost, and capability.
🌟 Final Thoughts
VBA can transform Excel from a manual spreadsheet tool into a surprisingly powerful reporting automation platform. 💻⚙️
Instead of repeatedly importing data, filtering records, calculating totals, building PivotTables, formatting worksheets, creating charts, exporting PDFs, and distributing files, users can encode the workflow once and allow Excel to repeat it automatically.
A well-designed VBA reporting system can follow a process such as:
Raw data → validation → cleaning → calculation → summarization → visualization → formatting → export
The biggest advantage is repeatability.
The same rules are applied every time.
The same calculations are performed.
The same formatting appears.
The same reports are generated.
This reduces manual effort while improving consistency. 📊✅
For small and medium-sized businesses that already depend heavily on Excel, VBA can be especially valuable because it allows companies to automate reporting without immediately replacing their entire data infrastructure.
The important lesson is that large datasets do not necessarily require large amounts of repetitive human work.
Once a reporting process is clearly defined, much of it can be turned into logic.
And once that logic is written in VBA, Excel can perform the repetitive part again and again—while the analyst focuses on what the numbers actually mean. 🚀📈