
Businesses often store important information in Excel spreadsheets but present that information through PowerPoint slides. Sales teams may track monthly revenue in Excel and summarize it in a presentation. Finance departments may maintain budgets in spreadsheets and create management-reporting decks. Project managers may keep schedules and KPIs in Excel but need polished slides for weekly meetings. 📈📑
When this process is done manually, employees may repeatedly:
- Copy tables from Excel
- Paste charts into PowerPoint
- Update slide titles
- Replace old numbers
- Resize objects
- Reformat text
- Save a new presentation
If the same presentation must be produced every week or month, this becomes repetitive and error-prone.
VBA, or Visual Basic for Applications, can automate much of this workflow. ⚙️💻
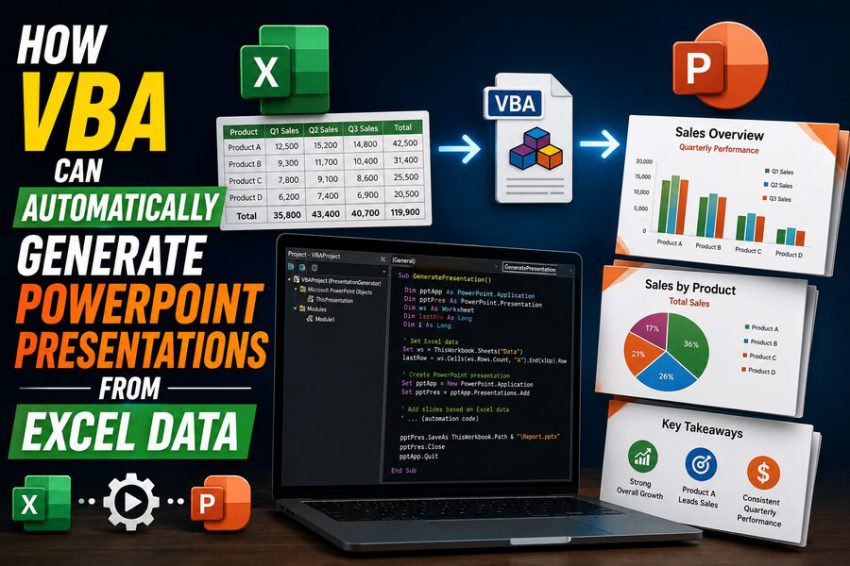
With VBA, Excel can open PowerPoint, create a new presentation, add slides, copy charts and tables, insert text, apply formatting, and save the finished deck—all from a macro.
This turns Excel from a passive data source into an automated reporting engine.
🧠 What Is VBA?
VBA stands for Visual Basic for Applications.
It is a programming language built into Microsoft Office applications such as:
- Excel
- PowerPoint
- Word
- Access
- Outlook
VBA allows users to automate repetitive Office tasks.
For example, an Excel macro can:
- Read cells
- Calculate values
- Format worksheets
- Create files
- Send commands to other Office applications
The ability to control one Office program from another is what makes automated PowerPoint generation possible.
Excel can use VBA to communicate with PowerPoint through Microsoft’s object model. 🔗
🧩 Understanding the Office Object Model
Microsoft Office applications expose their features as programmable objects.
In PowerPoint, some important objects include:
ApplicationPresentationSlideShapeTextFrameChart
These objects have properties and methods.
For example:
- A
Presentationcan contain slides. - A
Slidecan contain shapes. - A
Shapecan contain text or an image. - A chart can be copied from Excel and pasted onto a slide.
VBA code can create and manipulate these objects step by step.
Conceptually, the hierarchy looks like this:
PowerPoint Application
⬇️
Presentation
⬇️
Slides
⬇️
Shapes, Charts, Tables, Text
Once you understand this hierarchy, automated presentation generation becomes much easier. 🧱
🚀 How Excel Can Launch PowerPoint
A VBA macro running inside Excel can create a PowerPoint application object.
A simplified example is:
Dim pptApp As Object
Set pptApp = CreateObject("PowerPoint.Application")
pptApp.Visible = True
This tells Windows to start PowerPoint programmatically.
The macro can then create a presentation:
Dim pptPres As Object
Set pptPres = pptApp.Presentations.Add
At this point, Excel has created a PowerPoint presentation without the user manually opening PowerPoint.
From here, the macro can build slides automatically.
🖼️ Creating Slides With VBA
Slides can be added through VBA using PowerPoint’s Slides.Add method.
For example:
Dim pptSlide As Object
Set pptSlide = pptPres.Slides.Add(1, 1)
The exact slide layout number depends on the PowerPoint layout being used.
A macro can create different slide types for different sections of a report.
For example:
Slide 1: Executive summary
Slide 2: Revenue chart
Slide 3: Regional performance
Slide 4: Product performance
Slide 5: Risks and next actions
If the data changes every month, the same code can rebuild the deck using the latest spreadsheet values. 🔄
📝 Inserting Excel Data Into Slide Text
Suppose cell B2 contains total monthly revenue.
VBA can read that value:
Dim revenue As Double
revenue = Range("B2").Value
The macro can then insert it into a PowerPoint text box.
For example:
pptSlide.Shapes.AddTextbox(1, 50, 100, 400, 50).TextFrame.TextRange.Text = _
    "Monthly Revenue: $" & Format(revenue, "#,##0")
If the value in Excel is:
$2,450,000
the generated slide can display:
Monthly Revenue: $2,450,000
This makes it possible to create dynamically updated presentations without manually editing figures.
📊 Copying Excel Charts Into PowerPoint
One of the most useful automation techniques is copying charts directly from Excel.
Imagine Excel contains a chart named:
Chart 1
VBA can copy it:
Worksheets("Dashboard").ChartObjects("Chart 1").Chart.CopyThen PowerPoint can paste it onto the current slide:
pptSlide.Shapes.PasteThe pasted chart can also be repositioned and resized.
For example:
With pptSlide.Shapes(pptSlide.Shapes.Count)
    .Left = 50
    .Top = 120
    .Width = 600
    .Height = 350
End With
This allows VBA to create clean, consistent slide layouts automatically. 📈✨
🖇️ Copying as an Image vs. an Editable Chart
When transferring Excel charts into PowerPoint, the macro can often choose between different formats.
🖼️ Paste as an Image
Advantages:
- Consistent appearance
- Less chance of accidental changes
- Often smaller and more stable
Disadvantages:
- Chart cannot easily be edited in PowerPoint
📊 Paste as an Embedded Chart
Advantages:
- Editable inside PowerPoint
- Can retain underlying Excel chart functionality
Disadvantages:
- Larger file size
- More complicated links or embedded data
- Greater risk of formatting differences
The best choice depends on whether the presentation needs to remain editable.
For automated recurring reports, pasting charts as pictures can sometimes be simpler and more reliable.
📋 Copying Excel Tables
VBA can also copy cell ranges.
Suppose a worksheet contains a summary table in:
A5
The macro could copy that range and paste it onto a slide.
For example:
Worksheets("Summary").Range("A5:F12").Copy
pptSlide.Shapes.PasteSpecial
The result can be inserted as:
- A PowerPoint table
- A picture
- An embedded Excel object
For highly formatted dashboards, copying the table as an image may preserve Excel’s appearance most accurately.
For presentations where users need to edit individual values, an editable table may be preferable. 📋
🎨 Automatically Formatting the Presentation
Automation becomes much more powerful when VBA also controls formatting.
A macro can set:
- Font size
- Font family
- Bold text
- Alignment
- Shape dimensions
- Object positions
- Slide backgrounds
- Chart sizes
For example:
With pptSlide.Shapes.Title.TextFrame.TextRange
    .Text = "Monthly Sales Performance"
    .Font.Size = 28
    .Font.Bold = True
End With
Standardized formatting ensures every automatically generated deck follows the same visual structure.
This is especially useful for organizations that produce dozens or hundreds of recurring reports.
🏢 Using a PowerPoint Template
Instead of building every presentation from a blank file, a VBA macro can start from an existing PowerPoint template.
This is usually a better approach for professional reporting.
The template can already contain:
- Company branding
- Logo placement
- Fonts
- Backgrounds
- Slide masters
- Standard layouts
- Footer information
The macro only needs to replace or add dynamic content.
For example, VBA can open a template presentation:
Set pptPres = pptApp.Presentations.Open("C:\Reports\MonthlyTemplate.pptx")The automated presentation then inherits the organization’s established design.
This separates visual design from data automation. 🎨⚙️
🧭 Creating Slides Based on Excel Rows
A powerful technique is generating one PowerPoint slide for every row of data.
Imagine an Excel worksheet containing:
| Region | Revenue | Growth | Manager |
|---|---|---|---|
| North | 1,200,000 | 8% | Maya |
| South | 950,000 | 3% | Daniel |
| West | 1,450,000 | 11% | Aisha |
A VBA loop can move through every row.
For each region, it can create a new slide.
The slides might automatically display:
North Region
Revenue: $1.2M
Growth: 8%
Manager: Maya
Then the next slide is generated for South, followed by West.
This approach is extremely useful when presentations contain repetitive structures such as:
- Customer summaries
- Regional reports
- Product dashboards
- Store performance reports
- Project updates
- Employee scorecards
Instead of manually creating 100 nearly identical slides, VBA can generate them in seconds. ⚡
🔁 Using Loops to Build Large Decks
The core structure might look conceptually like this:
For i = 2 To lastRow

    region = Cells(i, 1).Value
    revenue = Cells(i, 2).Value
    growth = Cells(i, 3).Value

    'Create slide
    'Add title
    'Add revenue
    'Add growth
    'Add chart

Next i
The loop continues until every required row has been processed.
This is one of the biggest advantages of using code: once the presentation logic is written correctly, it can scale from five slides to hundreds.
📅 Automating Recurring Monthly Reports
Consider a finance department that creates a monthly management presentation.
The spreadsheet may already contain:
- Revenue
- Expenses
- EBITDA
- Cash flow
- Forecast
- Budget variance
- Department KPIs
Without automation, an analyst might spend several hours every month copying this information into PowerPoint.
With VBA, the process could become:
- Update Excel data.
- Refresh calculations and charts.
- Click Generate Presentation.
- VBA opens the presentation template.
- Slides are populated.
- Charts are inserted.
- Titles and reporting dates are updated.
- The finished deck is saved.
This can reduce hours of repetitive work to minutes—or even seconds depending on the complexity. ⏱️
🧾 Dynamic Slide Titles
Slide titles can also be driven by Excel values.
Suppose:
A2 = “Europe”
The VBA code can create a title:
pptSlide.Shapes.Title.TextFrame.TextRange.Text = _
    Range("A2").Value & " Performance"
The resulting title becomes:
Europe Performance
If another row contains:
Asia Pacific
the next slide automatically becomes:
Asia Pacific Performance
This makes templates reusable across many business units.
📌 Adding Text Boxes Automatically
PowerPoint text boxes can be created directly through VBA.
For example:
Set shp = pptSlide.Shapes.AddTextbox(1, 60, 150, 300, 40)
shp.TextFrame.TextRange.Text = "Growth: 12.4%"
The macro can change the position and content depending on the data.
Conditional logic can even alter the wording.
For example:
If growth > 0 Then
    statusText = "Growth improved"
Else
    statusText = "Growth declined"
End If
This allows the presentation to contain automatically generated commentary. 🧠
🚦 Using Conditional Logic
VBA can make decisions based on spreadsheet values.
Suppose a KPI target is 95%.
If actual performance is:
98%
the macro could display:
Target exceeded ✅
If performance is:
89%
it could display:
Below target ⚠️
The code may look conceptually like:
If actual >= target Then
    message = "Target exceeded"
Else
    message = "Below target"
End If
This transforms the presentation from a simple copy-and-paste output into a data-driven reporting system.
📈 Automatically Selecting Charts
A presentation does not always need the same chart for every slide.
VBA can choose charts dynamically.
For example:
- Revenue → column chart
- Market share → pie chart
- Monthly trend → line chart
- Variance → waterfall chart
The macro can inspect the data type or report section and insert the appropriate visual.
This is especially useful in large automated reporting systems.
🔗 Linking Excel and PowerPoint
Charts can also be pasted as linked objects.
With linking, PowerPoint retains a connection to the Excel workbook.
If the underlying spreadsheet changes, the chart in the presentation may be updated.
This is useful for presentations that remain connected to a central data source.
However, links introduce risks.
If the Excel file is:
- Renamed
- Moved
- Deleted
- Stored on an inaccessible network drive
the PowerPoint links may break.
For standalone presentation delivery, embedding or pasting static images may be safer.
🗂️ Saving the Generated Presentation
VBA can automatically create a filename using values such as:
- Reporting month
- Customer name
- Department
- Current date
For example:
fileName = "Sales_Report_" & Format(Date, "yyyy-mm-dd") & ".pptx"
pptPres.SaveAs "C:\Reports\" & fileName
A file created on August 27, 2026 might be named:
Sales_Report_2026-08-27.pptx
This is useful for automated archival and reporting workflows. 📁
📨 Combining PowerPoint Automation With Email
VBA can extend the workflow even further.
After generating a presentation, Excel can potentially automate Outlook to prepare an email with the PowerPoint file attached.
The workflow becomes:
Excel data
⬇️
PowerPoint report generated
⬇️
Presentation saved
⬇️
Email prepared
This can automate a large portion of recurring reporting.
For security and governance reasons, organizations may still require users to review messages before they are sent.
⚙️ Early Binding vs. Late Binding
When controlling PowerPoint from Excel VBA, developers commonly use either early binding or late binding.
🔹 Early Binding
The developer adds a reference to the Microsoft PowerPoint Object Library.
Advantages include:
- IntelliSense support
- Easier coding
- Named constants
- Better compile-time checking
Example:
Dim pptApp As PowerPoint.Application🔹 Late Binding
The code creates generic objects:
Dim pptApp As ObjectAdvantages include:
- Fewer reference-version problems
- Easier distribution across different Office installations
The earlier examples use late binding because it is often more portable.
🧯 Error Handling Is Important
Automation scripts should anticipate problems.
Possible failures include:
- PowerPoint is unavailable
- A chart name has changed
- The workbook path is incorrect
- A worksheet is missing
- Required data is blank
- The output file is already open
VBA can use error handling to prevent unexpected failures.
For example:
On Error GoTo ErrorHandlerA good macro should provide useful messages rather than simply crashing.
Professional automation requires careful error handling, especially when many people will use the workbook.
🧹 Cleaning Up PowerPoint Objects
After the presentation is created, VBA should properly release objects.
Conceptually:
Set pptSlide = Nothing
Set pptPres = Nothing
Set pptApp = Nothing
Poor object management can leave hidden PowerPoint processes running in the background.
For occasional macros this may be merely annoying, but for large automated workflows it can consume memory and create reliability problems.
🔒 Macro Security Considerations
VBA macros can perform powerful actions, so Microsoft Office applies security restrictions to them.
Organizations may block unsigned or downloaded macros.
Companies using VBA automation at scale may need:
- Trusted locations
- Digitally signed macros
- Controlled distribution
- Access permissions
- Code review
Users should never enable macros from unknown or untrusted sources simply because a file requests it. 🔐
📊 Example: Automated Sales Presentation
Imagine a workbook containing sales data for 25 regions.
A VBA reporting solution could automatically create:
Slide 1 — Executive Overview
- Total revenue
- Total growth
- Top-performing region
- Largest risk
Slides 2–26 — Regional Performance
Each slide could contain:
- Region name
- Revenue
- Growth percentage
- Target achievement
- Regional chart
Slide 27 — Company Trend
A chart showing monthly revenue.
Slide 28 — Conclusion
Automatically generated summary observations.
Without automation, producing this 28-slide deck every month could involve hundreds of repetitive edits.
With VBA, the same structure can be regenerated from updated data automatically. 🚀
🏦 Applications in Finance
Finance teams can automate presentations containing:
- Budget vs. actual analysis
- Monthly financial statements
- Cash-flow trends
- Department costs
- Forecast updates
- Financial ratios
Because these reports often use standardized templates, they are particularly suitable for automation.
A single workbook can become the data source for both analytical calculations and executive presentation output.
🛒 Applications in Sales
Sales teams can automatically create:
- Territory summaries
- Pipeline reviews
- Customer presentations
- Sales forecasts
- Account-performance slides
For example, each salesperson could receive a customized presentation generated from filtered Excel data.
The macro could loop through each employee, filter their records, generate a deck, and save it with their name.
🏭 Applications in Operations
Operations teams can automate:
- Production reports
- Safety dashboards
- Inventory presentations
- Quality-control reports
- Supply-chain KPIs
- Plant performance reviews
Because operations reporting often involves repeating the same charts with new weekly data, VBA can significantly reduce reporting effort.
👥 Applications in HR
Human resources teams might generate slides showing:
- Headcount
- Hiring trends
- Turnover
- Training completion
- Diversity metrics
- Absence rates
A macro can use the latest HR spreadsheet to update a management presentation without recreating each chart manually.
💡 Why VBA Automation Saves More Than Time
Time savings are obvious, but automation provides other benefits too.
✅ Fewer Copy-Paste Errors
Manual reports may accidentally use an outdated number or chart.
Automation pulls directly from defined Excel sources.
🎨 Consistent Formatting
Every deck uses the same dimensions, layouts, and typography.
🔄 Repeatability
The process produces predictable output every reporting cycle.
📈 Scalability
One macro can create many reports or hundreds of slides.
🧠 More Analyst Time for Thinking
Employees can spend less time moving numbers and more time interpreting them.
These benefits can be particularly valuable in organizations with recurring reporting requirements.
⚠️ Limitations of VBA-Based PowerPoint Automation
VBA is powerful, but it is not ideal for every situation.
Potential challenges include:
- Windows and Office dependencies
- Macro-security restrictions
- Difficult maintenance of very large scripts
- Fragile object names
- Differences between Office versions
- Complex formatting requirements
If an organization needs server-side generation, web-based automation, or extremely large-scale reporting, technologies such as Python, .NET, Power Automate, Office Scripts, or specialized reporting platforms may be better options.
But for businesses already heavily invested in desktop Excel and PowerPoint, VBA remains extremely practical.
🧠 Best Practices for Building Reliable Automation
A well-designed VBA presentation generator should separate three things:
Data
Keep source data organized in clearly structured Excel tables.
Logic
Use VBA to determine what information goes where.
Design
Keep branding and layout inside the PowerPoint template wherever practical.
This architecture makes the system easier to update.
If the company redesigns its slide theme, you update the template instead of rewriting hundreds of formatting commands.
If the data structure changes, you update the Excel-to-slide mapping.
Separation reduces maintenance complexity. 🧩
🚀 From Macro to Reporting System
A simple macro might begin by copying one chart into one slide.
Over time, it can evolve into a complete reporting system that:
- Refreshes data.
- Validates required fields.
- Calculates KPIs.
- Opens a PowerPoint template.
- Creates dynamic slides.
- Inserts charts and tables.
- Generates commentary.
- Saves customized decks.
- Logs what was generated.
- Prepares distribution.
At this point, Excel is no longer merely a spreadsheet—it becomes an automation controller for business reporting. ⚙️📊
🏁 Final Thoughts
VBA can automatically generate PowerPoint presentations from Excel by controlling PowerPoint through Microsoft’s Office object model.
An Excel macro can:
Read spreadsheet data → open PowerPoint → create slides → insert text → copy charts and tables → apply formatting → save the completed presentation.
The biggest advantage is repeatability.
A presentation that once required several hours of manual copying and formatting can potentially be rebuilt from current data with a single command. ⚡
This is especially valuable for recurring reports such as:
- Monthly financial reviews
- Sales dashboards
- Operational scorecards
- Project updates
- Management presentations
- Customer reports
The technology is not simply about making slides faster.
It reduces human error, improves consistency, and allows analysts to focus on interpreting results rather than repeatedly transferring data between applications.
For organizations that already rely heavily on Excel and PowerPoint, VBA provides a surprisingly powerful bridge between the two.
With a well-designed spreadsheet, a reusable presentation template, and carefully written automation logic, an entire presentation can effectively become a dynamic output of the underlying data rather than a document that must be manually rebuilt every reporting cycle. 📊➡️🖥️➡️📽️✨