
It is the last working day of the month. A manager needs the sales report, the operations team wants an exceptions list, and someone has just noticed that three new rows were added to the source workbook. You copy figures into a template, adjust formulas, save a new file, and hope nothing was missed.
That routine is familiar because spreadsheets are excellent at holding data but poor at enforcing a repeatable reporting process. Manual reporting also creates a quiet risk: the same task may be done slightly differently each month, even when the numbers are correct.
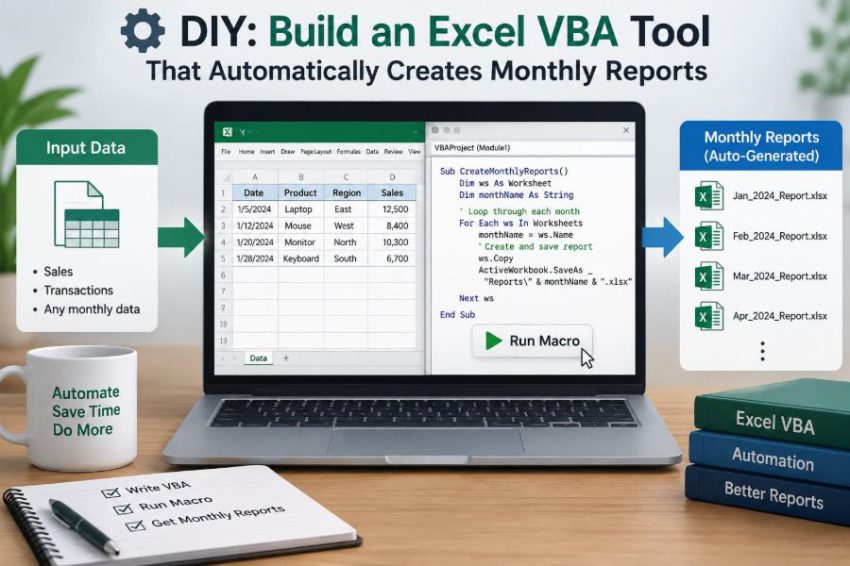
Excel VBA can turn that recurring sequence into a small reporting tool. With one button, it can validate incoming data, calculate metrics, build a formatted report, save it with a consistent name, and leave an audit trail of what happened.
The goal is not to create a mysterious “one-click” macro that nobody can maintain. It is to build a clear, dependable tool whose steps match the business process it supports.
🧭 Define the reporting job before writing VBA
Start with the work, not the code. Write down what arrives each month, who uses the final report, which calculations are required, and what the finished file must contain.
For example, a monthly sales report might use transaction rows with Date, Region, Product, Salesperson, and Amount. Its output could include total sales, target comparison, regional summaries, a list of unusually large returns, and a PDF or workbook for distribution.
A useful boundary is this: the tool should automate repeatable decisions, while unusual business judgments remain visible for a person to review.
🎯 Choose a small first version
A reliable first release does not need every chart, email, and special-case rule. Begin with a minimum useful result: import or read the data, create a report sheet, calculate a few agreed metrics, and save the workbook.
This approach gives users something testable early. It also prevents a common VBA project failure: building a large macro before confirming that the report structure and definitions are actually right.
- Version 1: summary table and saved report workbook.
- Version 2: validation messages and exception sheet.
- Version 3: charts, PDF export, or controlled email distribution.
🗺️ Map inputs, outputs, and rules
Think of the tool as a pipeline. Data enters through an input sheet or selected file; VBA checks and transforms it; the output appears in dedicated report sheets or a new workbook.
Document the rules beside that map. Does “monthly sales” mean invoice date or payment date? Are cancelled orders excluded? Is a blank region an error, or should it be grouped as “Unassigned”? These are reporting rules, not programming details, but VBA must express them exactly.
🧱 Design a dependable workbook layout
Keep source data, configuration, report output, and logs separate. A practical structure uses worksheets named Data, Config, Report, Exceptions, and Log.
This separation matters because a report user should not accidentally overwrite imported records, and a macro should not need to guess where a setting is stored. Avoid relying on whichever sheet happens to be active.
📋 Use Excel Tables for source data
An Excel Table, also called a ListObject in VBA, expands as rows are added and gives columns stable names. That is safer than assuming the data always ends at row 500.
Name the table something meaningful, such as tblSales. Then a column can be referenced as tblSales.ListColumns("Amount") rather than by a fragile letter such as column F.
Tables do not eliminate data-quality problems, but they make changing row counts much easier to handle.
🔒 Treat the input as a contract
Your macro should state what it expects: required column headers, valid date values, numeric amounts, and perhaps a single reporting period. This is an input contract.
If the contract is broken, stop before creating a polished but misleading report. A message such as “The Amount column is missing” is far more useful than a later “Subscript out of range” error.
🧮 Decide which calculations belong in VBA
VBA is good at orchestrating work: preparing sheets, looping through records, applying rules, and producing files. Excel formulas are often better when users need to inspect or adjust a calculation directly in the report.
For instance, VBA can place a SUMIFS formula into a summary table, while an in-memory VBA calculation may suit a temporary validation count. The right choice depends on transparency, speed, and whether the result needs to remain live after the macro finishes.
🧠 Understand the core VBA objects
Most Excel automation is expressed through objects. A Workbook contains worksheets; a Worksheet contains ranges, tables, charts, and cells; a Range represents one cell or many cells.
Use explicit references whenever possible. This is safer than ActiveWorkbook, ActiveSheet, or Selection, which can point somewhere unexpected when a user clicks during execution.
Dim wsData As Worksheet
Dim wsReport As Worksheet

Set wsData = ThisWorkbook.Worksheets("Data")
Set wsReport = ThisWorkbook.Worksheets("Report")
🧰 Enable the Developer tools and save correctly
In Excel, enable the Developer tab through the application options, then open the Visual Basic Editor with Alt+F11. Store standard procedures in a standard module, such as Module1 or a clearly named module like modMonthlyReport.
Save the tool as an Excel Macro-Enabled Workbook with the .xlsm extension. A regular .xlsx file cannot retain VBA code.
🏷️ Use clear names and explicit variables
A variable should reveal the thing it holds: reportMonth, lastRow, totalAmount, or outputPath. Names are documentation for the next reader, including you next quarter.
Place Option Explicit at the top of every module. It requires variables to be declared, helping catch typing mistakes such as using totlAmount in one line and totalAmount in another.
Option Explicit

Dim totalAmount As Currency
Dim reportMonth As Date
Dim lastRow As Long
Use Long for row numbers. Excel worksheets have more rows than the maximum held by the older Integer type.
📅 Capture the reporting period deliberately
Never quietly assume that the current month is the report month. A report may be rerun after a correction, or prepared early for a prior period.
Read the month from a configuration cell, a validated prompt, or the source data itself. Store it as a real Date value, then derive a display label and a file-safe label from it.
reportMonth = ThisWorkbook.Worksheets("Config").Range("B2").Value
fileLabel = Format(reportMonth, "yyyy-mm")
displayLabel = Format(reportMonth, "mmmm yyyy")
✅ Validate before calculating
Validation should happen near the beginning of the main procedure. Check that the source table exists, required columns are present, there is at least one data row, and the selected period is valid.
Then inspect critical values. Blank product codes, text entered in an amount field, or dates outside the selected month might be routed to an Exceptions sheet instead of silently ignored.
- Check structural issues first: sheets, table, headers, and permissions.
- Check record-level issues next: blanks, invalid dates, and invalid numbers.
- Decide whether each issue should stop the run or be reported for review.
🧹 Clear only the previous output
A report must be repeatable. Before rebuilding it, clear the previous report body and exception list while preserving headers, formulas that belong to the template, and any fixed layout.
Avoid using Cells.Clear on an entire worksheet unless the sheet is intentionally disposable. It can remove formats, validation rules, and labels that the macro expects later.
With wsReport
    .Range("A6:K" & .Rows.Count).ClearContents
    .Range("A6:K" & .Rows.Count).ClearFormats
End With
In a production template, tighten that range to the actual report area rather than clearing more than necessary.
⚡ Read and write data in batches
Cell-by-cell loops are easy to understand but can become slow with larger datasets because each worksheet read or write crosses the VBA–Excel boundary. Read a range into a Variant array, process the array in memory, then write results back in one operation.
This does not mean every macro needs advanced optimization. For a few dozen rows, clear code may matter more. For recurring reports with thousands of records, batch processing becomes a practical improvement.
📚 Use a dictionary to build summaries
A dictionary stores values by a unique key. It is useful when the report needs totals by region, product, cost centre, or another category that may change from month to month.
For example, the key might be a region name and the item might be its running sales total. This avoids hard-coding a fixed list of regions into a long chain of If statements.
Dim totals As Object
Set totals = CreateObject("Scripting.Dictionary")

If Not totals.Exists(regionName) Then totals.Add regionName, 0
totals(regionName) = totals(regionName) + salesAmount
Late binding with CreateObject avoids an additional reference setting, though it provides less editor assistance than early binding.
📊 Build the report around questions
Good reports answer questions in the order readers ask them. Put the period, headline totals, and major variance near the top. Put regional or product detail beneath it, and put record-level exceptions on a separate sheet.
Do not turn the report into a duplicate of the raw data. A manager often needs “Where did performance change?” before needing every underlying transaction.
🎨 Apply formatting as part of the output
Formatting communicates meaning. Use a clear title, visible reporting period, descriptive column headings, readable number formats, and restrained emphasis for totals and warnings.
Apply number formats rather than converting numbers to formatted text. A numeric sales total formatted as currency can still be summed and charted; a string such as “$1,250.00” may not behave as a number.
With wsReport.Range("B3")
    .Value = grandTotal
    .NumberFormat = "$#,##0.00"
    .Font.Bold = True
End With
📈 Add charts only when they clarify a decision
A chart is useful when it reveals a pattern faster than a table. A monthly trend chart can show movement over time; a sorted bar chart can compare regional results. A chart that merely repeats one number does not add much.
Keep chart ranges dynamic or recreate them from the refreshed summary area. Also avoid overloading a report with decorative visuals that compete with the central message.
🚩 Create an exceptions workflow
Not every questionable record should stop the entire report. A separate Exceptions sheet can list rows with missing fields, dates outside the period, negative values requiring review, or unmatched codes.
This provides accountability: users can see what was excluded or flagged, correct the source where appropriate, and rerun the tool. It is better than hiding imperfect records simply to make totals look clean.
🧾 Add a simple audit log
A log gives the tool a memory. Record the run date and time, reporting period, user name if suitable for your environment, count of source rows, count of exceptions, and output filename.
The log is not a replacement for formal audit controls, but it makes ordinary troubleshooting much easier. When someone asks why a report changed, you can identify which run produced it and whether the input count differed.
💾 Save outputs with predictable names
Use a consistent filename such as Monthly_Report_2025-03.xlsx. The year-month pattern sorts chronologically and avoids ambiguous labels like “March report final final.”
Decide what should happen when the file already exists. Overwriting may be appropriate in a controlled shared process; creating a timestamped version may be safer where revisions need to be retained. Either way, tell the user what the macro did.
📄 Export PDF as a separate publishing step
PDF export is useful when recipients should read the report without changing it. Build and check the workbook report first, set print areas and page layout, then export the relevant sheet or sheets.
Do not assume the on-screen layout will print well. Wide tables, hidden columns, page breaks, and scaling can change the result, so PDF output deserves a deliberate test.
🖱️ Give users a safe way to run it
A button on a control sheet can make the tool approachable, but the button should run one clearly named public procedure, such as RunMonthlyReport. Keep the detailed work in smaller helper procedures.
Display brief status messages: validation started, report created, exceptions found, file saved. Users should know whether the process completed rather than having to infer success from a flickering screen.
🛡️ Handle errors without hiding them
Error handling should clean up application settings and present a useful message. It should not turn every problem into “Something went wrong.” Capture the technical error in the log if appropriate, then explain the next action in plain language.
On Error GoTo CleanFail
Application.ScreenUpdating = False

' Main reporting steps go here

CleanExit:
Application.ScreenUpdating = True
Exit Sub

CleanFail:
MsgBox "The report could not be created: " & Err.Description, vbExclamation
Resume CleanExit
Use error handling sparingly around anticipated problems. Broadly suppressing errors with On Error Resume Next can let the macro continue after an important operation failed.
🚀 Restore Excel settings after faster processing
Turning off screen updating, events, or automatic calculation can speed up a report run. However, these are application-wide settings, so the macro must restore them even if an error occurs.
Save the original calculation mode before changing it. Otherwise, a user may be left wondering why their workbook formulas no longer recalculate after the macro crashes.
🧪 Test with realistic and awkward data
Testing only a clean sample proves very little. Test an empty table, one valid row, many rows, blank cells, duplicate records, unexpected categories, text in numeric columns, and reruns for the same month.
Also compare the output with a manually calculated small sample. This is one of the best ways to catch a misunderstood business rule rather than merely a coding error.
🔍 Reconcile key totals before releasing
Reconciliation means comparing a result with an independent expectation. For a sales report, compare the macro total with a pivot table, a trusted source-system total, or a manual sum of a controlled sample.
If the totals differ, investigate before distributing the report. The cause may be valid—perhaps the macro excludes cancelled transactions—but it must be understood and documented.
🧩 Organize code into focused procedures
A long procedure that imports, validates, calculates, formats, saves, and emails is difficult to test. Separate it into focused routines such as ValidateInput, BuildSummary, WriteReport, and SaveOutput.
The main procedure then reads like the reporting process itself:
Public Sub RunMonthlyReport()
    ValidateInput
    PrepareReportSheets
    BuildSummary
    WriteReport
    WriteExceptions
    SaveOutput
End Sub
Small procedures also make later changes safer. A formatting update should not require touching the calculation logic.
📝 Keep configuration out of the code
Values likely to change—target thresholds, output folder, report title, or selected month—belong in a protected Config sheet or named cells, not scattered through VBA as “magic numbers.”
Code should describe the process; configuration should hold controlled choices. This distinction makes routine maintenance possible without asking someone to edit a macro.
👥 Plan for handover and maintenance
A VBA reporting tool is often used by someone other than its author. Include a short Read Me sheet explaining where to place data, which fields are required, how to run the report, what exceptions mean, and where outputs are saved.
Document assumptions in code comments where the reason is not obvious. Comments should explain why a rule exists, not merely repeat what a line of code visibly does.
🔐 Respect macro security and data access
Macros can be disabled by organizational policy, and users should not be encouraged to enable unknown code. Distribute the tool through approved channels and explain its purpose clearly.
Also consider where the report is saved and who can access it. A convenient shared folder may be inappropriate if the data includes payroll, customer details, or other sensitive information. VBA can automate a process, but it does not remove normal data-governance responsibilities.
⚖️ Know when VBA is the wrong tool
VBA is a strong fit for a workbook-centred process used within desktop Excel. It is less suitable when many people need simultaneous web access, when source data is extremely large, when a reliable server-side schedule is required, or when the process needs enterprise-grade permissions and monitoring.
In those cases, Power Query, Power BI, Office Scripts, database reporting, or a dedicated application may be more appropriate. Choosing a different tool is not a failure of VBA; it is good solution design.
🏁 Build for repeatability, not just speed
The central value of an automated monthly report is repeatability. The same inputs and rules should produce the same clearly structured output, with visible exceptions and a record of the run.
Start with a modest workflow, define the data contract, avoid selecting active cells, validate before calculating, and test the awkward cases. Then improve the tool in controlled steps as the reporting process becomes clearer.
A useful Excel VBA reporting tool does more than save clicks: it makes the reporting process consistent, reviewable, and easier to trust. Build that foundation first, and the monthly deadline becomes far less fragile. ⚙️📊✅